It has been quite some time since the article “Malware Analysis – Dridex & Process Hollowing” where we went over the analysis of banking trojan known as Dridex and how it leverages a technique known as process hollowing to extract an unpacked version of itself into memory. In that article, we briefly explained this technique and used OllyDbg to illustrate the different steps. Today, we will continue where we left off, extract the unpacked sample from memory and continue the analysis. This unpacked sample is known as the Loader. The Loader is what we will be looking at. We will mainly use a debugger to perform our analysis in order to understand more about what it does and get visibility into its functionality. Please note that a bit of familiarity with OllyDbg is needed in order to follow the steps described.
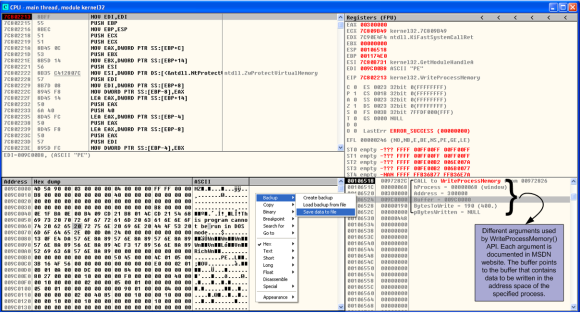
You might want to read the last article and read more about the process hollowing technique in order to situate yourself before we start. As a refresher, the last step we did was to use OllyDbg to set a breakpoint on WriteProcessMemory() API and execute the binary. Once the breakpoint was reached we could see the moment before WriteProcessMemory() API was called and the different arguments in the stack.
In OllyDbg in the stack view (bottom right) we could see that one of the arguments is buffer. The data stored in this buffer is of particular interest to us because it contains the contents of the malicious code that is going to be written to the legitimate process i.e., the unpacked sample.
So, to continue our analysis we need to extract the unpacked sample into disk. We can perform this by saving contents of the buffer argument from the WriteProcessMemory() API into a file. In OllyDbg, in the memory view (bottom left) we right click – Backup – Save data to file and save the file with the suggested name _009C0000.mem.
With the binary extracted we can, again. start the initial steps of malware analysis. As normal we perform basic static analysis in 3 steps. The first step is to profile the file. We can easily determine its an PE32 executable file using the Linux “file” command. In addition, we compute the MD5 of the file which is c2955759f3edea2111436a12811440e1. With this fingerprint we can search different online tools such as VirusTotal in order to find further information about it.
Second step is to run the strings command against the binary. The strings command will display printable ASCII and UNICODE strings that are embedded within the file. This can disclose information about the binary functionality.
The third step is to use some tool like the PE Analysis Toolkit from Fernando Mercês or CFF explorer from Daniel Pisteli to analyze the Win32 PE headers. Extracting information from the PE headers can reveal information about API calls that are imported and exported by the program. It can also disclose date and time of the compilation and other embedded data of interest. The binary contains library dependencies and these dependencies can be looked at in order to infer functionality through static analysis. These dependencies are included in the Import Address Table (IAT) section of the PE structure so the Windows loader (ntdll.dll) can know which dll’s and functions are needed for the binary to properly run.
Noteworthy, is that in this binary, the PE headers don’t contain an Import Directory and we are unable to determine its dependencies because the IAT is missing. This makes this binary more stealthier and more complex to analyze. As result we will need to load this sample into OllyDbg and try to find out more information about it while stepping throughout the code. The binary needs to somehow resolve the Imports.
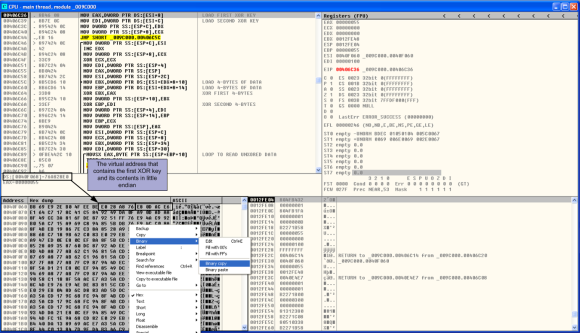
Dridex is known to use different techniques to encode and obfuscate data. This sample is no different. We open the _009C0000.mem file into OllyDbg and while going back and forth and stepping into the different functions, we can observe that in the beginning of the execution there is a XOR function that is performed. By following the memory addresses that are used across the different function arguments from the different routines, and looking in detail into the memory and stack pane we can see that the names of the different API calls start to appear. There is a function at virtual address 0x00406c0f that performs XOR of a chunk of data stored at virtual address 0x0040f060. It uses 2 XOR 32-bits keys. In the picture below you can see in the dissasembler window (top left) the instruction that loads the first XOR key into the register EAX. By following the function loop and see the content of the memory addresses we would be able to see that LoadLibraryA() API appears as string.
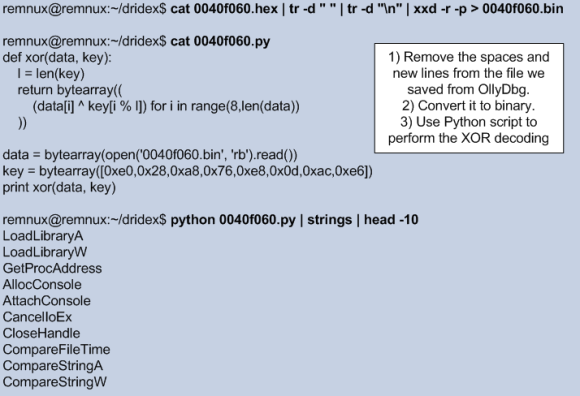
Because going over the loop in OllyDbg and observe the API calls being resolved is a tedious process we can perform the decoding offline. We know where the chunk of data starts and the XOR keys. So, we can save the chunk of data into a file in order to perform the decoding and get all the data. To do this in OllyDbg, we set a breakpoint in the XOR function at virtual address 0x00406c0f, In the dissasembler window (top left), Ctrl + G and in the expression to follow dialog box enter the function address. Then press F2 to set a breakpoint in that line. Then hit F9 to run the sample. It will pause the execution when the breakpoint is hit. Then press F7 to step into each instruction until you hit the function that loads the first XOR key at address 0x00406c36. Then go into to the Memory dump window (Bottom left corner), hit Ctrl + G and insert the memory address 0x0040f060. Then select the data until you see a series of null bytes. Right click and choose Binary – Binary Copy. Below a print screen of this step.
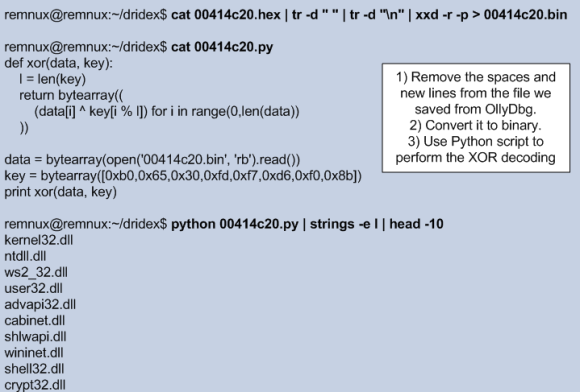
Then we can paste the data to a text file and use a small python script to perform the XOR decoding using the obtained keys and see that the binary has an extensive list of 355 imported functions.
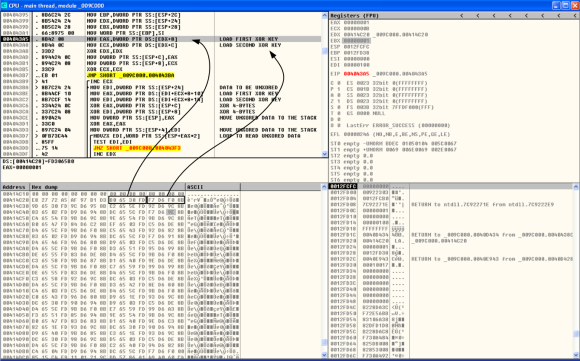
This was the first XOR operation. Then after decoding the API it needs, the binary decodes the chunk of data stored at 0x00414c20 and gets the names of the libraries like kernel32.dll, ntdll.dlland others. This operation is performed by a function stored at Virtual Address 0x0040d42f. In the picture below you can see in the dissasembler window (top left) the instruction that loads the first XOR key into the register EAX.
Using the same technique has previously described, we can save this chunk of data into a file and perform the XOR decoding in order to get the list of libraries that are used by the binary.
The strings decoding happens throughout the execution. There are 5 chunks of data that are decoded using XOR and 2 x 32-bits keys. The below table shows the XOR keys and the offset address of the data and functions that are called in order to decode the strings:
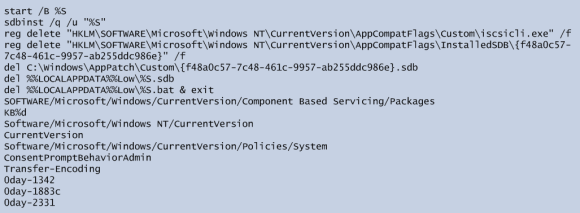
By decoding all the chunks we get visibility into the binary functionality and can deduce its malicious intent. For the sake of brevity and because the list of strings is quite extensive, this is left as exercise to the reader. Nonetheless, below is a small portion of the decoded strings. These ones are associated with the UAC bypass technique used by Dridex to get Admin rights.
That’s it for part 1. On part 2 we will look into how the C&C addresses are obtained and some of the techniques used by Dridex to generate the XML messages used by the loader.
Sample MD5: c2955759f3edea2111436a12811440e1

No comments:
Post a Comment