Thursday, December 29, 2016

Arcsight Health monitoring

Arcsight Monitoring tools

Since there are many elements in an ArcSight environment, ensuring continuous operation of all might require:
·         Ensuring that source devices keep sending events.
·         Ensuring that connectors operate properly.
·         Ensuring that the ArcSight systems (Logger, ESM, Express) operate properly.
·         Ensuring that the infrastructure used by those elements, including operating system and network.

Some of the solutions you might want to check to monitor an ArcSight environment are:

ArcSight Management Center


ArcSight Management Center (ArcMC) is an ArcSight product that can be used to manage and monitor ArcSight systems. It currently can have managed and monitors Loggers, Connectors, Connector Appliances and other ArcMC systems.

ESM health monitoring


ESM has system resources that are useful for monitoring:

Resource
URI
What can you find there?
Database performance statistics
/All Dashboards/ArcSight Administration/ESM/System Health/Storage/CORR Engine/Database Performance Statistics
free space available for the tables such as Arc_Event_Data and Arc_System_Data
ESM system Information
/All Dashboards/ArcSight Administration/ESM/System Health/ESM System Information
Memory use
Event throughput
/Dashboards/System Health/Events/Event Throughput
Peak and average EPS
Connector status
Right click "connectors-->All Connectors" and select "Grid View" to quickly see if any connector is down.

Other tools available are:
·         You can also try the ESM Health Monitoring package developed at HP CDC, is a combination of scripts and ESM content to monitor the ESM manager itself. It monitors the like of as IO, heap usage, garbage collections, cpu, eps and connector caching. The package is robust, but complex and not fully documented.
·         Monitor ESM/CORR with JMX, ELK and TICK - Use Java JMX monitoring API to monitor the manager and connectors operating environment (community contribution)

Logger content packs

·         Logger Operations Health Dashboards is a presentation which contains queries for creating Logger dashboards for monitoring event ingress rate and quality.

Other options

·         We! Analyze (open source: discussion, download) - a stand alone tool for monitoring connectors and devices to ensure they send events. The tool analyzes connector logs files rather than events and therefore has pros and cons when compared to the "ArcSight System Monitoring" package above.
·         ArcSight Connector watchdog FlexConnector - a Flex connector for analyzing agent.log and providing the results as events to ESM/Logger. As a FlexConnector, it is a great starting point for others to add their own parsing code.


Wednesday, December 21, 2016

TOP 6 SIEM Use Cases

Use Case 1

Detection of Possible Brute Force Attack

With the evolution of faster and more efficient password cracking tools, brute force attacks are on a high against the services of an organization. As a best practice, every organization should configure logging practices for security events such as invalid number of login attempts, any modification to system files, etc., so that any possible attack underway will get noticed and treated before the attack succeeds. Organizations generally apply these security policies via a Group Policy Object (GPO) to all the hosts in their network.
To check for brute force pattern, I have enabled auditing on logon events in the Local Security Policy and I will be feeding my System Win:Security logs to Splunk to check for a brute force pattern against local login attempts.


Note: EventCode: 4625 is used in new versions of the Windows family like Win 7. In older versions, the event code for invalid login attempts is 675, 529.
After this, I log off my machine, and entered the password incorrectly three times in attempt to impersonate a brute force attack.

Since these activities gets logged in Win:Security, which in turn is feeding Splunk in real time, an alert will be created in Splunk, giving analysts an incident to investigate and take responsive actions, like changing the firewall policy to blacklist that IP.

Use Case 2

Detection of Insider Threat

Reportedly, more than 30 percent of attacks are from malicious insiders in any organization. Therefore, every organization must keep the same level of security policies for insiders also.

Acceptable Use Monitoring (AUP)

Acceptable Use Monitoring covers a basic questions, i.e. what resource is being accessed by whom and when. Organizations generally publish policies for users to understand how they can use the organization’s resources in the best way. Organizations should develop a baseline document to set up threshold limits, critical resources information, user roles, and policies, and use that baseline document to monitor user activity, even after business hours, with the help of the SIEM solution.
For example, the below illustration is of logging a user activity on an object. For demonstrative purposes, I have created a file named “Test_Access” on my system. Auditing on object access is enabled in my system, like below in the Local Security Policy.

Enabling auditing on security policies is not enough, and now I have to enable the auditing on the respective file, also named “Test_Access” in this case. I have enabled auditing for Group Name –”Everyone” on this file. Organizations should fingerprint all the sensitive files and corresponding privileges and user group access on them.

For demonstrative purposes, I have selected all the object properties to be audited.

After this, I accessed the “Test_Access” file, which generates an event in Security logs with Event ID 4663, giving user name, action performed, time it was accessed, etc. This useful information can be fed into the SIEM solution through security logs to detect any unauthorized or suspicious object access.

Organizations should develop fingerprints on all the sensitive documents, files and folders, and feed all this information to respective security solutions such as data leakage prevention solutions, application logs, WAF, etc. into the SIEM solution to detect a potential insider threat. Organizations can develop the below use cases in the SIEM solution under AUP.
·         Top malicious DNS requests from user.
·         Incidents from users reported at DLP, spam filtering, web proxy, etc.
·         Transmission of sensitive data in plain text.
·         3rd party users network resource access.
·         Resource access outside business hours.
·         Sensitive resource access failure by user.
·         Privileged user access by resource criticality, access failure, etc.
Use Case 3

Application Defense Check

Besides network, perimeter, and end point security, organizations must develop security measures to protect applications. With attacks like SQL injection, Cross site scripting (XSS), Buffer overflow, and insecure direct object references, organizations have adopted security measures like secure coding practices, use of Web Application Firewall (WAF) which can inspect traffic at layer 7 (Application layer) against a signature, pattern based rules, etc. Along with the log of applications, organizations must also feed SIEM with logs of technologies such as WAF, which can correlate among various security incidents to detect a potential web application attack. One of the very important points to check for in a sensitive application is that the application should encrypt the sensitive information like PII in the logs as well, as these logs will be fed into SIEM, and if unencrypted, sensitive information could be exposed in SIEM.
Organizations must also develop a strategy to secure the operating system (OS) platform onto which the application is hosted. OS as well as application performance logging features must also be enabled. Below are some of the use cases that can be implemented in SIEM to check Application defense.
·         Top Web application Attacks per server.
·         Malicious SQL commands issued by administrator.
·         Applications suspicious performance indicator, resource utilization vector.
·         Application Platform (OS) patch-related status.
·         Web attacks post configuration changed on applications.


Use Case 4

Suspicious Behavior of Log Source

Expected Host/Log Source Not Reporting

Log sources are the feeds for any SIEM solution. Most of the SIEM solution these days comes with an agent-manager deployment model, which means that on all the log sources, light weight SIEM agent software is installed to collect logs and pass them to a manager for analysis. An attacker, after gaining control over a compromised machine/account, tends to stop all such agent services, so that their unauthorized and illegitimate behavior goes unnoticed.
To counter such malformed actions, SIEM should be configured to raise an alert if a host stops forwarding logs after a threshold limit. For example, the below search query (SPL) in Splunk will raise an alert if a host has not forwarded the logs for more than one hour.
As soon as an alert is received with the IP address of the machin under attack, the Incident Response Team (IRT) can start mitigating this issue.

Unexpected Events Per Second (EPS) from Log Sources

Another common pattern found among compromised log sources is that attackers tends to change the configuration files of endpoint agents installed and forward a lot of irrelevant files to the SIEM manager, causing a bandwidth choke between the endpoint agent and manager. This affects the performance of real time searches configured, storage capacity of underlying index for storing logs, etc. Organizations must develop a use case to handle this suspicious behavior of log sources. For example, below is the search (SPL) created in Splunk which can detect unusual forwarding of events from log sources in one day.
An alert will be configured with it to get triggered whenever the amount of EPS from a log source exceeds a threshold value for the IRT team to investigate.
Use Case 5
Malware Check
These days, organizations believe in protecting their network end to end, i.e. right from their network perimeter with devices like firewall, Network Intrusion Prevention System (NIPS), till the endpoints hosts with security features like antivirus and Host Intrusion Prevention System (HIPS), but most organizations collect reports of security incidents from these security products in a standalone mode, which brings problem like false positives, etc.
Correlation logic is the backbone of every SIEM solution, and correlation is more effective when it is built over the output from disparate log sources. For example, an organization can correlate various security events like unusual port activities in firewall, suspicious DNS requests, warnings from Web Application firewall and IDS/IPS, threats recognized from antivirus, HIPS, etc. to detect a potential threat. Organizations can make following sub-use case under this category.
·         Unusual network traffic spikes to and from sources.
·         Endpoints with maximum number of malware threats.
·         Top trends of malware observed; detected, prevented, mitigated.
·         Brute force pattern check on Bastion host.

Use Case 6

Detection of Anomalous Ports, Services and Unpatched Hosts/Network Devices

Hosts or network devices usually get exploited because they often left unhardened, unpatched. Organizations first must develop a baseline hardening guideline that includes rules for all required ports and services rules as per business needs, in addition to best practices like “default deny-all”.
For example, to check for the services being started, systems logs from event-viewer must be fed into the SIEM solution, and a corresponding correlation search must be created against the source name of “Service Control Manager” to detect what anomalous services got started or stopped.

Organizations can also check out for vulnerable ports. Services can be exposed by deploying a vulnerability manager and running a regular scan on the network. The report can be fed into the SIEM solution to get a more comprehensive report encompassing risk rate of the machines in the network. Some use cases that an organization can build from reports are:
·         Top vulnerabilities detected in network.
·         Most vulnerable hosts in the network with highest vulnerabilities.
Another important aspect that an organization should constantly monitor as part of the SIEM process is that all clients or endpoints are properly patched with software updates and feed the client patch status information into the SIEM solution. There are various ways an organization can plan out for this check.
·         Organizations can plan out to check the patch–related status by deploying a Vulnerability Manager and running a regular scan to check out for unpatched endpoints.
·         Organizations can deploy a “centralized update manager” like WSUS and feed the results of the updated status of endpoints into the SIEM solution or can feed the logs of the manager endpoint deployed on endpoints directly into SIEM to detect all unpatched endpoints in the network.

CONCLUSION

Above use-cases are not a comprehensive SIEM security check list, but in order to have success with SIEM, the above listed use cases must be implemented at the minimum on every organization’s check list.

Top 10 Use Cases for SIEM

1. Authentication Activities
Abnormal authentication attempts, off hour authentication attempts etc, using data from Windows, Unix and any other authentication application.
2. Shared Accounts
Multiple sources(internal/external) making session requests for a particular user account during a given time frame, using login data from sources like Windows, Unix etc. 
3. Session Activities
Session duration, inactive sessions etc, using login session related data specifically from Windows server.
4. Connections Details
Connections can be genuine or bogus. Suspicious behavior may include connection attempts on closed ports, blocked internal connections, connection made to bad destinations etc, using data from firewalls, network devices or flow data. External sources can further be enriched to discover the domain name, country and geographical details.
5. Abnormal Administrative Behavior
Monitoring inactive accounts, accounts with unchanged passwords, abnormal account management activities etc, using data from AD account management related activities.
6. Information Theft 
Data exfiltration attempts, information leakage through emails etc, using data from mail servers, file sharing applications etc.
7. Vulnerability Scanning and Correlation
Identification and correlation of security vulnerabilities detected by applications like Qualys against other suspicious events. 
8. Statistical Analysis
Statistical analysis can be done to study the nature of data. Functions like average, median, quantile, quartile etc can be used for the purpose. Numerical data from all kind of sources can be used to monitor relations like ratio of inbound to outbound bandwidth usage, data usage per application, response time comparison etc.
9. Intrusion Detection and Infections
This can be done by using data from IDS/IPS, antivirus, anti-malware applications etc.
10. System Change Activities 
This can be done by using data for changes in configurations, audit configuration changes, policy changes, policy violations etc.


Thursday, December 8, 2016

Understanding SIEM: correlation basics

While events are a mandatory part of SIEM, as the acronym implies, correlations are not. That said, they became a synonym to the term SIEM. Should they be considered a core element of SIEM? Are they useful at all? To answer that we first need to examine what they are and what they can be used for.

Correlations vs. Query and search

Correlations are used by the SIEM as a key analysis method for the collected events, but it is not the only method. The archrival methods are query and search, both focusing on analyzing a batch of events at a later time rather than analyzing events as the come. The pros and cons of each method are key to understanding SIEM products and current dynamics in the SIEM landscape, most notably the move from SIEM to “big data”.
In this article we will focus on what correlations can do, what they are useful for, and what they are not ideal for. A later article will address search and query and will enable us to compare both.

Event egress processing (a.k.a. “correlations”) functionality

There is no standard for correlation logic language – often called “rules” – and each SIEM uses a different paradigm and terminology for creating those rules. Moreover, correlation capabilities are often distributed within a single SIEM solution between different modules: some at the collectors, some at intermediate aggregators and some at dedicated central correlation engines. The following sections try to avoid the actual implementation details to describe common functionality that correlation engines offer for processing and analyzing events.

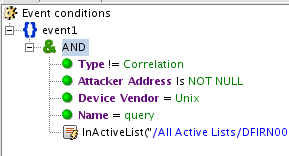
Filtering

filter
An ArcSight filter
Starting with the simplest implies we are the furthest one can get from the dictionary definition of correlations, however just dropping uninteresting events is an important event processing stage that streamlines the downstream processing of events and ensures less information overload.
Filtering may be based on data in the event, for example:
  • A successful connection through a firewall is deemed unimportant.
  • Specific event types sent by the source might be useless for the SOC.
Filtering can also be based on more complex conditions that might require the filtering to be performed after other correlation functions. An event might be discarded only after it is enriched with additional data which ensures it is OK. For example, a policy change in a firewall might be discarded if done by a valid firewall administrator or done on a test system, determined by looking up the role of the user and the firewall respectively. Even a “join” condition between events might be used to discard the events: in the firewall example above a preceding event might ensure that this is a valid change window.
In practice most simpler filtering is done early on in the event life cycle at the collectors and at times even at the source device: for example, Windows can preselect which events it sends to an event collector. This ensures filtering is distributed, saves network bandwidth and saves processing load from central SIEM servers.
More complex filtering needs to be done on the SIEM server. While many SIEMs do not have a concept of dropping events (and probably should have), they do filtering using “filtering in” rather than “filtering out”: the correlation logic selects the events that are useful and emphasizes them, usually by creating a correlation event that is included in the main event monitoring channel.

Enriching

Events as sent by the source are usually minimalistic in nature and to be useful for further analysis, automated or manual, additional information should be added to them. Common areas for enrichment include:
  • Host name resolution
  • Geographical information for IP addresses
  • Account name (system specific) to identity (organization wide) resolution
  • Adding user information such as role and department
  • Adding asset information for the devices involved in the event such as role (server, type of server, desktop etc.), business criticality and owner details.
  • Looking up the reputation of IP addresses and web sites reported in the event.
  • Assigning a priority taking into account the event and enrichment information.
Much of the enrichment information can be categorized as “context” which the SIEM has to import from dedicated sources or learn from the event stream. A special king of enrichment is based on joining multiple raw log entries, each containing partial information, into a single richer event.
Those simpler enrichment capabilities can be implemented at the collector layer. More advanced enrichments rely on data that is derived from previously collected events. An example is IP to user attribution: assigning a user name to events that include only an IP address. This is done by keeping a session list connecting users to IP addresses based on periodical events that include both user and IP address information such as login events.
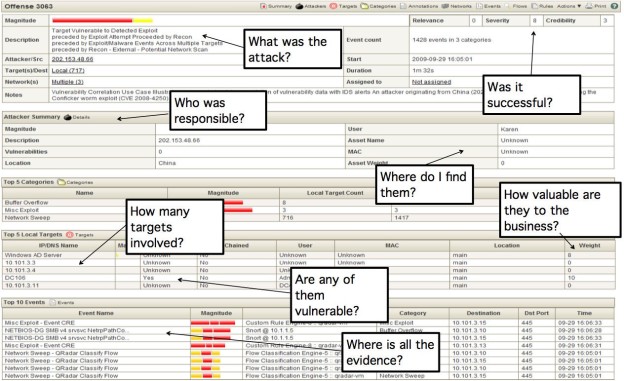
offenses
A QRadar offense exemplifying enrichment data such as Geo location and business priority

Aggregating

The simplest feature which focuses on “correlating” multiple events is aggregation: connecting together a number of similar events. Aggregation has two main use cases:
  • Reduce the event load by reporting once large amounts of repetitive information, usually by adding to the base data a count as well as time stamp for the first and last occurrence. This is commonly done at the collector layer.
  • Identify incidents that are manifested in the repetitive nature of the events such as port scans or brute force attacks.
An important consideration is that while event reduction usually aggregates very similar events, incident identification might require more complex conditions. For example, a port scan is usually identified by access to different ports rather than to the same port.

Joining and sequencing

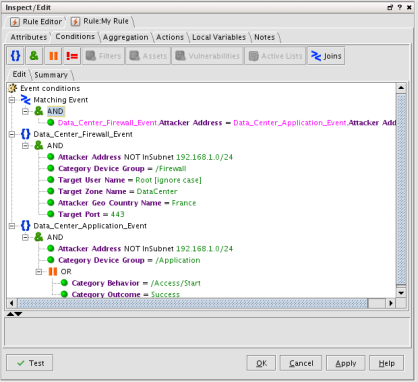
joins
An ArcSight join rule
Lastly, the holly grail of correlations is actually grouping a number of events that presumably tell a story when linked.  The brute force mentioned above for example might be more interesting if the repeated login failures were followed by a successful one. Sequencing is a variant of joining that required an order between the grouped events.
While joins are mostly associated with incident detection, they are useful also for filtering in or out events as demonstrated above. In many cases they can also enhance, or correct, events by grouping a number of related raw events (or log entries as discussed in “Understanding SIEM: Events, Alerts and Logs”) to one more useful event that includes all relevant data. This latter user case is the only variant of “join” that is commonly done at the collector level.

The plumbing

Since correlation rules implement logic, they require a “programming” toolset. Leaving aside the traditional programming tools such as variables and functions, the following are important aspects of rule programming that are characteristic to correlation rules.

Actions

The discussion above focuses on conditions. However just matching incoming events would not be useful. Upon matching, the rule has to be define actions to perform. Those actions usually fall into the following categories:
  • Raise an alert or notification to the SOC operator. This may take the form of an external alert using an e-mail or a pop up, or an internally by creating an incident (case or correlation event in ArcSight, offense in QRadar) and listing it in the SOC incidents channel.
  • Update a dashboard, a live alert channel or some other graphical representation. For example, a rule might switch a semaphore on or off on or update a counter on a dashboard to inform the operator on overall security posture.
  • Update the event, usually with enrichment data.
  • Generate yet another event, often called “correlation event”. While this can just be used as an internal alerting, it is commonly used to create complex correlation logic as this new event would itself be processed by the correlation engine.
  • Updating context information used for enrichment, usually in the form of updating lookup tables. This is often used to manage state lookup tables based on incoming events, for example to associate an IP address with a user based on logon events as discussed above.
  • Execute an external action, for example using an external command or a REST API call. While an external action can implement any additional logic, the most common uses are for automated remediation and for integration with external systems such as ticketing systems.

Triggering

While for simpler rules triggering actions is simply based on a successful match, more advanced correlations such as joins and aggregates complicate things. Specifically, how would the rule behave after an initial match is found? For example, if a rule tests for 50 events of some type in a 60 seconds window, how would the rule behave if 51 events are received within the window frame, or a 101? Or a 100 in 90 seconds?
To address that, rules may offer multiple triggering options: on first or subsequent events matching the condition, on first or subsequent threshold matches, periodically while the evaluation window is still open and when the evaluation window expires. A use case for such elaborate triggering might be to turn on and off a dashboard semaphore on a first threshold trigger and window expiration trigger signaling that the complex condition is active or not respectively.

What correlation engines do not do well?

The rather technical discussion above can hide the downsides of correlations as an analysis method for events, however correlation rules are not best suited for some use cases:

Signature and IoC matching

Users often try to use correlation rules to find indicator of compromise (IoCs for short) in the event stream. Examples might be ill-reputed URLs or SQL injection signatures. This requires matching one or more event fields to a long list of strings or regular expressions, which correlations engines just do not do well.
Correlation rules can usually compare a field as a whole to a list of values using a lookup. But while feasible, no correlation engine to date performs well search for a partial match of multiple signatures or regular expressions within a field. This is the realm of intrusion detection systems. Moreover, such a comparison is prone to evasions, something that a dedicated intrusion prevention system will mitigate.
It is worth noting that query and search are not much better at that.

Baselining and analytics

One of the biggest limitations of correlations as a modern-day analysis method id their limited usefulness for analytics. Most analytical models take into consideration a large amount of data which does not fit well the one event at a time nature of correlation rules.
A good example would be baselining: while a correlation rule can update a state table used for baselining, this is cumbersome to implement. It is often much easier to run a periodical query against collected events to create a baseline.
It must be noted that correlations rules can be used effectively to test an event against a baseline and offer the benefit of providing real-time results. QRadar for example uses a dual approach for its behavioral correlation rules: search is used for building the baseline while a real time rule is used to evaluate events against the baseline.

Performance considerations

Correlations are a rather optimal method for analyzing events as they consider each event individually, in memory, as it is received by the SIEM. In many cases utilizing correlations well is far superior performance wise to search based analysis and may also provide more correct results. For example, attributing event to a user using an IP to user lookup table is more accurate and efficient if done for each event individually at the time of receipt.
That said, correlations rules have performance implications to consider. The core challenge is the impact of the automated context management required for join and aggregate rules. Long time windows for such rules may require a very large number of open contexts (or “partial matches”). For example, a rule that would try to determine a “slow” port scan over a time window of a day would have to keep an open context for each source IP from which communication was received by the firewall for a day, something that can easily hog the resources of a SIEM server. The risk is that this performance hit is hidden from the cursory user. A more resource friendly solution would be to maintain explicit context by using granular rules that explicitly update a state table. The price is the development complexity discussed next.

Simplicity

Correlation rules use the event driven programming paradigm. When an event is received it is evaluated and triggers actions. Users often find it hard to grasp this paradigm opting for the more traditional procedural programming available using search and query analysis.
As an example, when faced with the requirement to match an events with a list of ill-reputed IP addresses, users will often use a report that based on a join query (or a lookup search) rather than build a rule to perform the lookup when the event is received. The latter will provide real time results and utilize less computing resources but is less intuitive to most.
Built in conditions that evaluate multiple events such as joins and aggregates hide the complexity from the user but often introduce hidden side effects such as the performance issues or the triggering complexity discussed above.

What are they useful for?

The discussion so far focused on the technical aspects of correlation rules. The goal was to clear some of the mystification built by the traditional use case driven description of correlations which is often marketing rather than technically driven.
Now that we understand the functionality provided by correlation rules, it is the time to re-visit the use case aspect and discuss how correlation rules actually contribute to security.
The first use that comes to mind is threat detection. Whether and how “joins” and “aggregates” contribute to better threat detection is a broad discussion left to a subsequent article.
However, correlations rules are more immediately useful for other use cases critical to efficient SOC management with focus on threat prioritization, investigation and mitigation rather than detection. Among those are:
  • Enhancing events, for example by joining a group of related but partial events into one event that has all needed attributes.
  • Filtering (in or out) events to ensure the operator is not flooded.
  • Prioritizing the remaining events using event data and context information to optimize event handling.
  • Enriching events, both to support filtering and prioritization as well as to provide more information for the analyst to assess and investigate an event.
In a following article we will discuss how search and query work and see which of those use cases better suit correlations (i.e. traditional SIEM) and which suit search (i.e. Splunk).